
There’s one side of me that says writing here again is freedom, and another that says it’s pointless — like walking a familiar path that has led nowhere before. Maybe both are true.
But this time, there’s one difference: consistency. I’m not making promises to anyone but myself. No publishing schedules, no expectations. Just showing up, writing, and sharing what I’ve been building over these past seven months.
It’s been a period of creating tools, experimenting with ideas, and turning research into something tangible. Some of it worked, some of it didn’t, but all of it taught me something worth sharing.
That’s what you’ll find here: code, projects, lessons, and insights collected along the way. For me, writing is a way to stay honest with my own work. For anyone reading, it’s an open invitation to follow along — if only to see where this path leads this time.
From Checklists to Craft
When I first started optimizing my site, I chased Lighthouse scores like everyone else. Pass the audits, hit 100, move on. But I realized I was treating standards like a checklist, not as part of the craft.
That’s when I started Wizard Compass — not just another Lighthouse wrapper, but a tool to explain why each audit matters.
I have mapped the curriculum to match Lighthouse category groups:
Performance
- Metrics (core scoring metrics)
- Diagnostics (fix opportunities)
- Hidden (supporting “insights”)
Accessibility (A11y)
- Navigation
- ARIA
- Color & Contrast
- Tables & Lists
- Language
- Best Practices
- A11y (Ungrouped audits)
Best Practices
- UX
- JavaScript Libraries
SEO
- Crawl
If you want to receive updates on the course development access wizardcompass.com, subscribe to the early access list.
Privacy in the Browser
While digging into audits, I noticed how invisible privacy issues are. So I built a Chrome extension that shows what sites are collecting and doing in the background.
I never published it, but it taught me how much is hidden — and how easily developers embed third-party scripts without realizing the trade-offs.
The trickier part was mapping players, so I've leveraged Wappalyzer data from their last open source version, which HTTP Archive uses to enrich its dataset.
I will write an article about it in detail and open-source the project soon.
Fonts and Readability
Color contrast checks got me wondering: why do formulas ignore the font itself? JetBrains Mono and Cabin are not the same.
So I started parsing Google Fonts with fonttools and jq, looking at metrics, x-height, and spacing. That became the seed for Font Lint.
You can take a look at fontlint.com and subscribe to be the first to test new font optimization tools and have access to datasets.
Colors and Accessibility
I love playing with colors, but I wanted palettes that were not only harmonious, but also accessible. I experimented with Delta E 2000 to ensure that the generated colors were perceptually distinct.
Then I added a contrast fixer: it suggests tweaks to color, font size, or weight until the text meets WCAG accessibility standards.
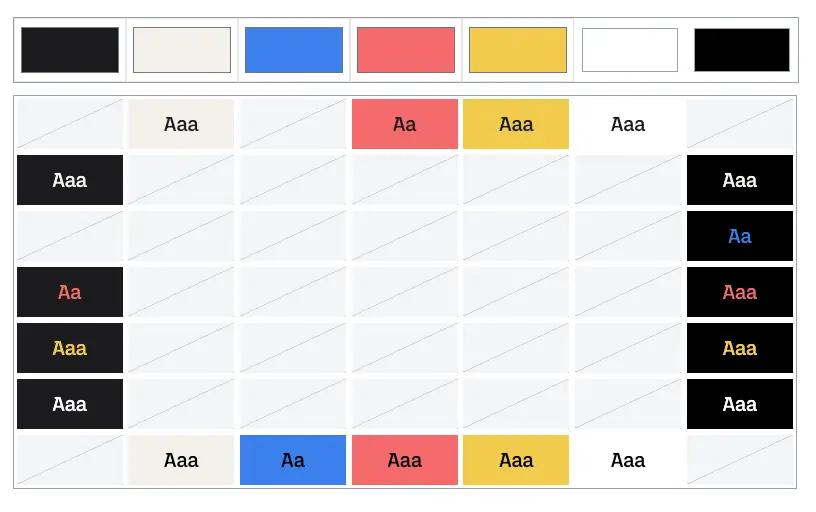
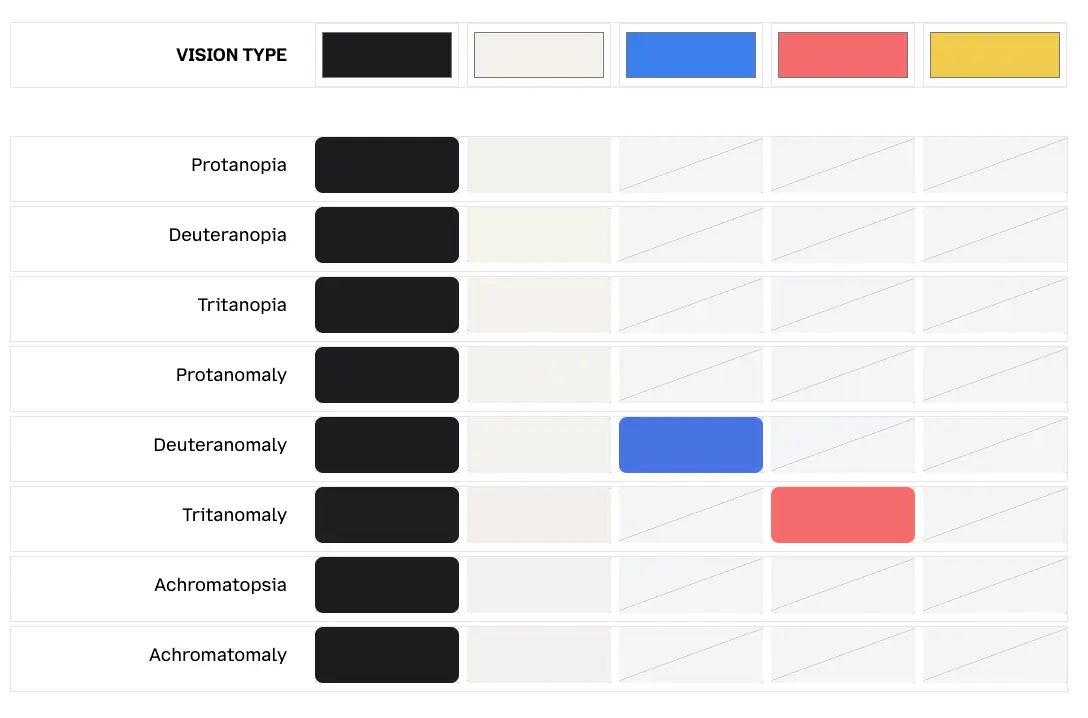
Seeing Differently
Accessibility isn’t abstract for me — I have high myopia and astigmatism. That’s what led me to simulate color vision deficiencies (CVDs).
I built transformations that show how colors and images look under different impairments, then validated whether the differences were still perceptible.
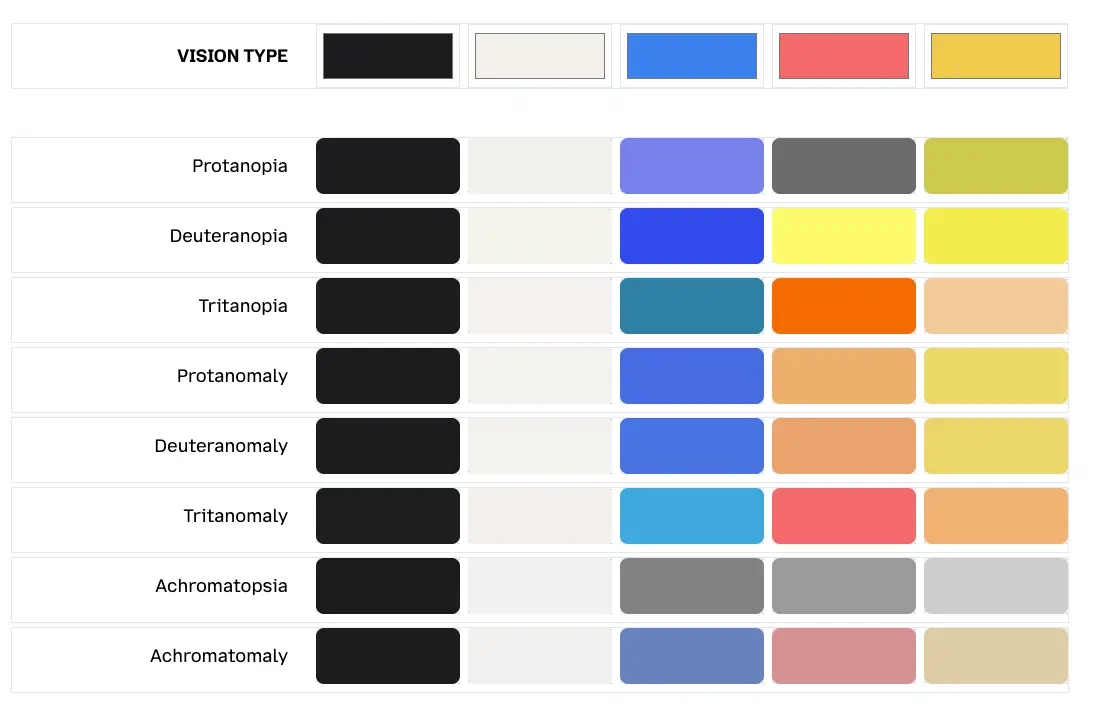
Ratings are calculated by first converting the colors to their simulated counterparts. The simulated values approximate the colors that would be seen by the fully deficient vision of each particular type. The simulated colors are then compared using the
DeltaE 2000color difference formula. A color difference value of11or more is considered passing; anything lower is too similar to distinguish.
The color difference meters visualize theDeltaEvalue to indicate how different the colors would appear for each color vision deficiency.
Source: https://leonardocolor.io/tools.html
I've explored images, which I will also write about. This is an unseen world by most people, and I intend to share my discoveries.
Next Steps
This is just the beginning of Open Lab. Each post will unpack one of these projects, with more code, demos, and lessons. I’m not chasing a schedule — I’ll publish as I can. But I will publish.